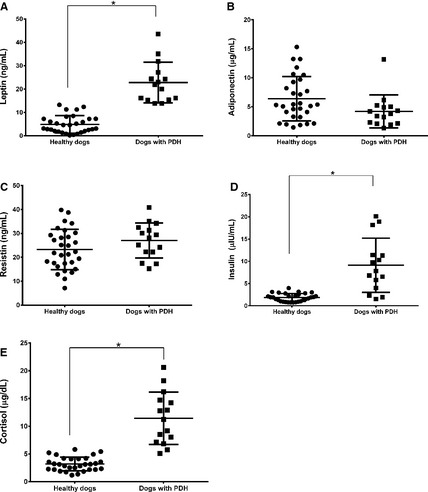
Figure 1.

Scatter plots of the serum leptin, adiponectin, resistin, insulin, and cortisol concentrations in healthy dogs (n = 30) and dogs with pituitary‐dependent hyperadrenocorticism (n = 15). The horizontal bars indicate the mean ± SD. *The mean values were significantly (P < .05) different in the 2 groups (unpaired t‐test).
