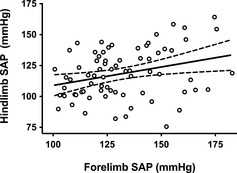
Figure 1.

Scatterplot and linear regression of forelimb and hindlimb systolic arterial pressure (SAP) obtained from 72 healthy Shetland Sheepdogs. The best‐fit regression line (solid) and 95% confidence intervals for the regression line (dotted lines) are shown. Forelimb and hindlimb systolic arterial pressure were weakly correlated (Pearsons r 2 = 0.09; P = .011).
