
Figure 2.
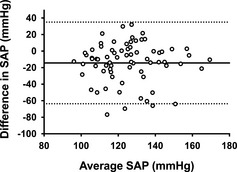
Bland‐Altman plot of the difference compared to the average for each forelimb and hindlimb systolic arterial pressure (SAP) measurement from 72 healthy Shetland Sheepdogs. The horizontal solid line represents the mean difference or bias of −14 mmHg in systolic arterial pressure between the hindlimb minus forelimb methods. The dashed lines represent ± 1.96 SD, or the 95% limits of agreement (−60 to 33 mmHg).