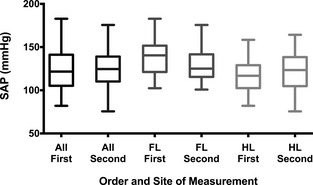
Figure 3.

Box and whiskers plot of systemic arterial pressure (SAP) measurements by order of measurement. The boxes extend from the 25th to the 75th percentile with the median shown by the midline; the whiskers are drawn from the lowest to the highest value (eg, entire range). The left 2 boxes in black show all the measurements of SAP obtained first (All First) as compared with all SAP measurements obtained second (All Second). The middle 2 boxes in dark gray show all the forelimb SAP measurements obtained first (FL First) as compared with all forelimb measurements obtained second (FL Second). The right 2 boxes in light gray show all the hindlimb SAP measurements obtained first (HL First) as compared with all hindlimb measurements obtained second (HL Second). No systematic difference was evident among any of the 3 comparisons (All First versus All Second, P = .47; FL First versus FL Second, P = .15; HL First versus HL Second, P = .73).
