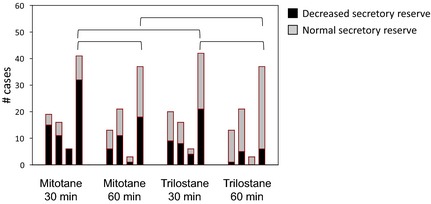
Figure 3.

Number of dogs with decreased aldosterone secretory reserve versus those with normal reserve according to level of control. Aldosterone concentrations measured at 60 minutes post‐ACTH. Black‐shaded area represents dogs with decreased aldosterone secretory reserve and gray‐shaded area represents dogs with normal reserves. In each group, the first bar represents the undertreated dogs, the second bar the optimally treated, the third bar the overtreated, and the fourth bar the 3 former groups combined. To compare the number of dogs with decreased aldosterone secretory reserve between treatment groups, among levels of control, or between times, the Fisher exact test or chi‐square was used. Groups connected by a bracket are significantly different.
