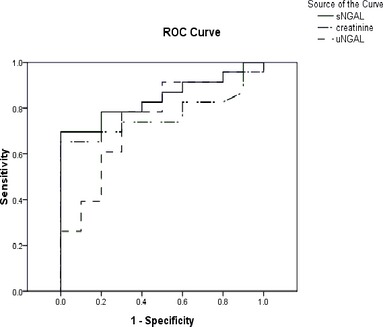
Figure 1.

Receiver‐operating characteristic (ROC) curve analysis for sNGAL, serum creatinine concentration, and uNGAL. The areas under the ROC (AUROC) for the sNGAL, uNGAL, and serum creatinine concentration curves are 0.843, 0.745, and 0.767, respectively (P < .05). Using a cutoff point of 50.6 ng/mL for sNGAL, the sensitivity was 69.6% and the specificity was 100%. When a cutoff for uNGAL of 51.4 ng/mL was used, the sensitivity was 78.3% and the specificity was 70%. For creatinine, the best cutoff point was 6.95, which had a sensitivity of 65.2% and a specificity of 90%.
