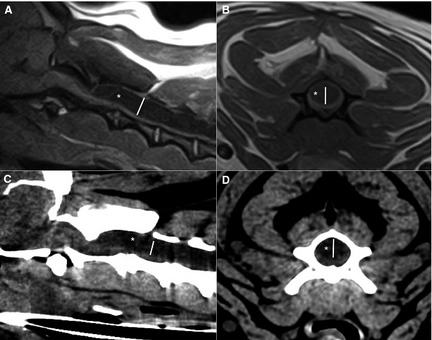
Figure 1.

Midsagittal (A) and transverse (B) T1‐weighted spin echo image and corresponding midsagittal (C) and transverse (D) computed tomography images of the cranial cervical spine of the same dog. A hypointense (A,B) or hypodens (C,D) cavity (white asterisk) is visible within the spinal cord. The syrinx width (white line) is measured perpendicular to the longitudinal axis of the spinal cord on the midsagittal images. On the transverse images the widest diameter (white line) at the same level is measured.
