
Figure 4.
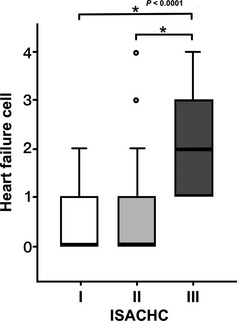
The heart failure cell level in each clinical severity (ISACHC classification). The box plot illustrates the significantly increased heart failure cell in the ISACHC III group than the class I and II with statistical significance marks (asterisk) and P value.