
Figure 2.
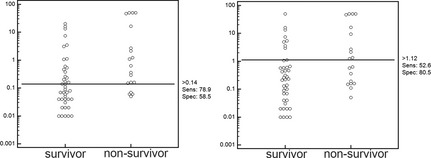
Dot diagram with optimal cutoff values (based on receiver operating characteristic analysis) for cardiac troponin I (cTnI) at admission (A) or using the peak cTnI concentration (B) to differentiate between survivor and nonsurvivor dogs.
Official websites use .gov
A
.gov website belongs to an official
government organization in the United States.
Secure .gov websites use HTTPS
A lock (
) or https:// means you've safely
connected to the .gov website. Share sensitive
information only on official, secure websites.
Dot diagram with optimal cutoff values (based on receiver operating characteristic analysis) for cardiac troponin I (cTnI) at admission (A) or using the peak cTnI concentration (B) to differentiate between survivor and nonsurvivor dogs.