
Figure 3.
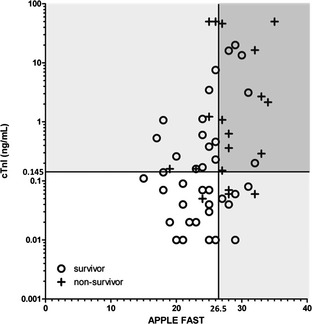
Serum cardiac troponin I (ng/mL) and the acute patient physiologic and laboratory evaluation (APPLE) fast score in 60 dogs with systemic inflammatory response syndrome. The vertical line represents the optimal predictive cutoff for the APPLE fast score. Dogs to the left of this line were predicted to survive by the APPLE fast score, those to the right were predicted to die. The horizontal line represents the optimal predictive cutoff for cardiac troponin I (cTnI). Dogs below this line were predicted to survive by cTnI, and those above were predicted to die. Both cutoff values were identified by receiver operating characteristic (ROC) analysis. The dark gray zone represents dogs predicted to die by cTnI and APPLE fast score, the white zone those predicted to survive and the light gray zone those predicted to die, by either cTnI or APPLE fast score (adapted from Langhorn et al).38