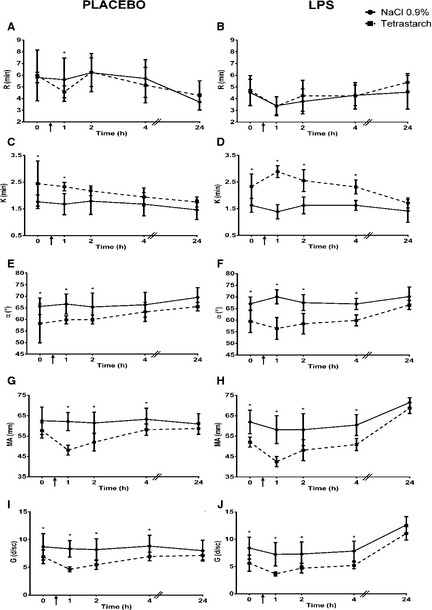
Figure 2.

Comparison of kaolin‐activated R (Reference interval: 2–6 minutes), K (Reference interval: 1–3 minutes), α (Reference interval: 48–75°), MA (Reference interval: 46–64 mm), and G (Reference interval: 4.2–8.0K d/sc) in dogs given 0.9% NaCl or tetrastarch after placebo or LPS administration. Time of fluid bolus represented as ↑. Significant differences between fluids (P < .019) are indicated with *. All values are expressed as mean ± SD.
