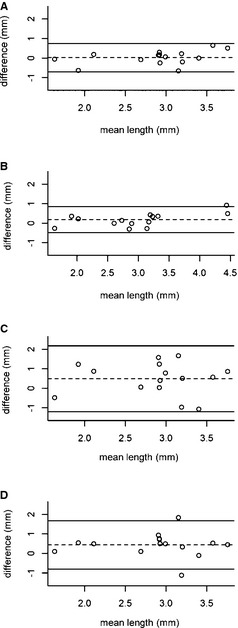
Figure 2.

Bland–Altman plot indicating agreement between the observers for the cerebellar herniation length on the different techniques. (A) T1WSE MR images, (B) T2WSE MR images, (C) precontrast CT images, (D) postcontrast CT images. The x‐axis corresponds to the mean value for both observers, whereas the y‐axis corresponds to the difference between the two observers. The mean of the differences (dashed line) and 95% limits of agreement (upper and lower lines) are indicated.
