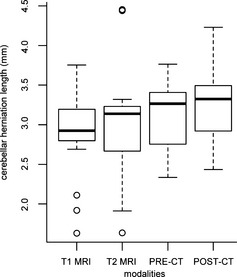
Figure 3.

Box‐and‐whisker plot, indicating median (horizontal bar), 25th and 75th percentiles (box), and range of cerebellar herniation length (mm) in Cavalier King Charles Spaniels on both sequences on MR images and pre‐ and postcontrast CT images. Overall, the median length and the range of the length of the CH was higher and longer on the CT images.
