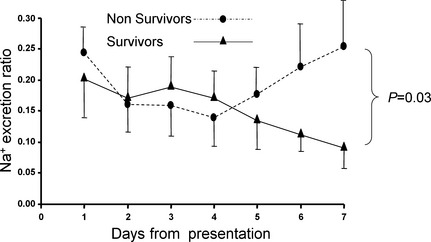
Figure 3.

Changes in excretion ratio of sodium in survivors (n = 4) and nonsurvivors (n = 6) over the 7‐day study period. Presented are the mean and the standard deviation (which is presented only as a positive or a negative deviation to prevent overlap).
