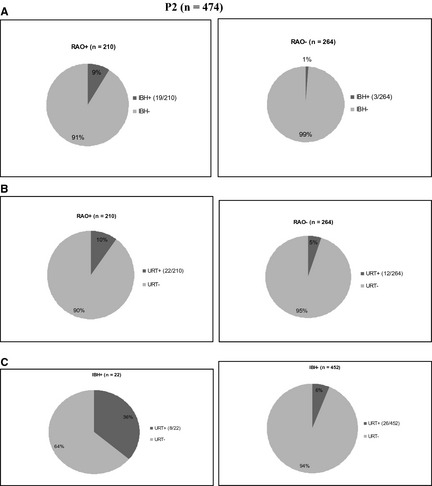
Figure 2.

(A, B and C) Pie chart illustrating the relative percentage (%) of recurrent airway obstruction (RAO+) (n = 19) and RAO− (n = 3) horses in P2 which were diagnosed with insect bite hypersensitivity (IBH) (9% and 1% respectively; A) and RAO+ (n = 22) and RAO− (n = 12) horses with urticaria (URT) (10% and 5% respectively; B) and the relative percentage of (%) of IBH+ (n = 8) and IBH− (n = 26) horses in P2 which were diagnosed with URT (36% and 6% respectively; C).
