
Figure 1.
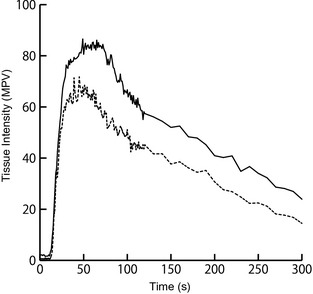
TICs showing mean pixel intensity in the pancreatic parenchyma of pancreatitis group (solid black line) and control group (dashed black line). TIC of the pancreatitis group is similar in shape, but is higher in intensity, and peaked at a later time when compared to control group. The wash‐out also is more gradual in the pancreatitis group. TIC, time‐intensity curve; MPV, mean pixel value.