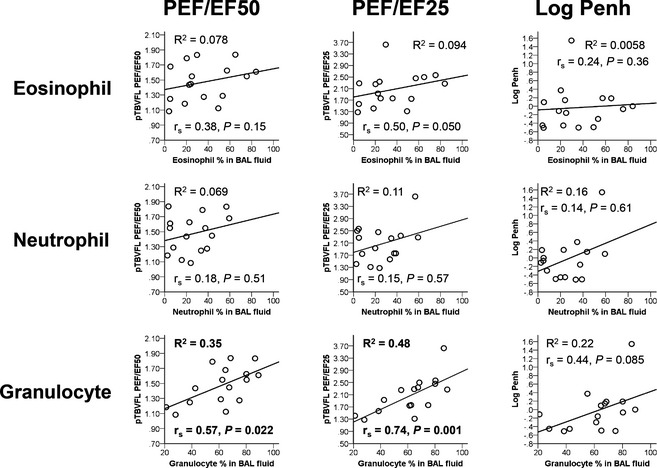
Figure 1.

Scatter plots showing the correlations between specific cell (eosinophil, neutrophil, and granulocyte) percentage in bronchoalveolar lavage fluid (BALF) and functional parameters representing airflow obstruction (PEF/EF50, PEF/EF25 and Log Penh). R 2 from Pearson correlation, Spearman's rho correlation (r s), and P values were included for each plot.
