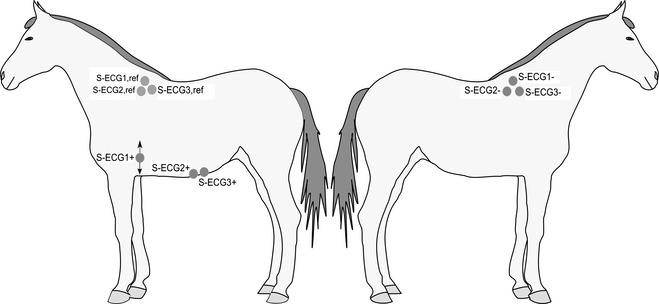
Figure 1.

ECG leads. S‐ECG1 and S‐ECG2: surface ECGs recorded simultaneously during the experiments. S‐ECG3: modified base‐apex surface ECG recorded during and 12–24 hours after the experiment. +/−/ref indicate positive, negative, and reference electrodes, respectively. Arrows at S‐ECG1+ indicate that this electrode was adjusted dorso‐ventrally until the recorded P wave had the highest amplitude possible.
