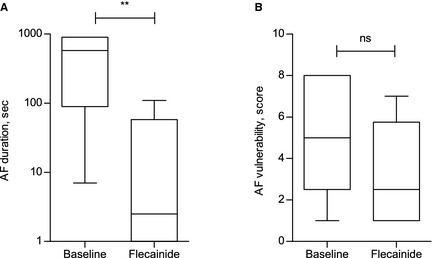
Figure 6.

Antiarrhythmic and potential protective effects of flecainide. Results presented as box plot, whiskers represent minimum to maximum values. (A) Atrial fibrillation (AF) duration at baseline and after flecainide treatment, **P = .003. Note that the Y‐axis is log‐transformed. (B) AF vulnerability at baseline and after flecainide treatment, ns: nonsignificant, P = .136. For each horse, AF duration was measured and compared using the AF induction setting shown at baseline to be effective at inducing AF episodes with a mean duration >1 minute (see text). For each horse, AF vulnerability was measured and compared using the AF induction setting shown to be effective at inducing a single AF episode >1 minute in duration before and after flecainide, respectively.
