
Figure 5.
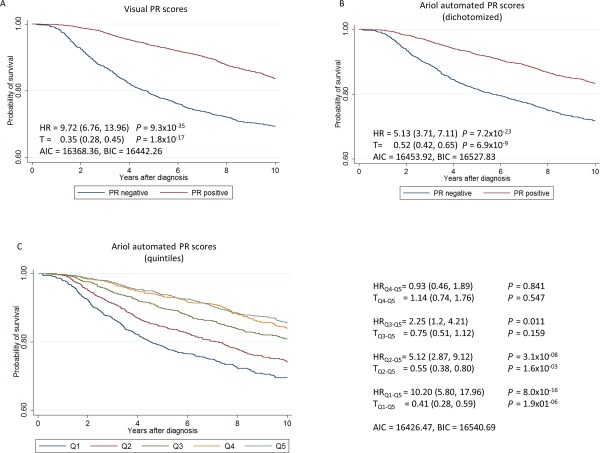
Kaplan–Meier survival curves and hazard ratios (HR) for 10‐year breast cancer survival by PR, based on 6115 subjects and 998 breast cancer specific deaths, using (A) pathologists data from study sites (positive/negative), (B) dichotomized (positive/negative) automated scores and (C) automated scores classified in quintiles.