
Figure 2.
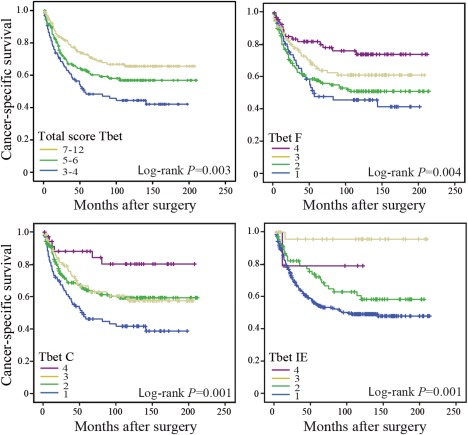
Cancer‐specific survival in CRC patients. Kaplan–Meier plots of cases scored for T‐bet total score: 3–4, low expression; 5–6, moderate expression; or 7–12, abundant expression; or T‐bet expression at intratumoural subsites: T‐bet F (front), T‐bet C (centre), and T‐bet IE (intraepithelium); score 1–4: 1 (no/sporadic), 2 (moderate), 3 (abundant), and 4 (highly abundant). Log‐rank test was used to calculate p‐values.