
Figure 4.
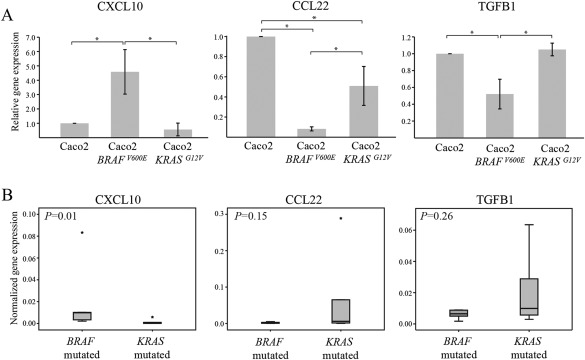
Expression of cytokine and chemokine genes in CRC. (A) Expression of CXCL10, CCL22 and TGFB1 was analysed by semi‐quantitative RT‐PCR in (A) human colon cancer cells Caco2, Caco2 cells stably expressing BRAFV600E (Caco2‐BRAFV600E), and Caco2 cells stably expressing KRASG12V (Caco2‐KRASG12V). Shown is the fold gene expression from four independent experiments ±standard deviation, with Caco2 control cells set as 1. Significant differences are indicated by * (p < 0.05). (B) Expression of CXCL10, CCL22 and TGFB1 was analysed by semi‐quantitative RT‐PCR in tumour specimens carrying oncogenic mutations in either BRAF (V600E) (n = 6) or KRAS (codon 12 and 13) (n = 6), and illustrated with box plots. Normalised gene expression is represented as the mean of 2‐ΔCt for each sample normalised against RPL13A. Outlier values (o) and far‐out values (*) are indicated.