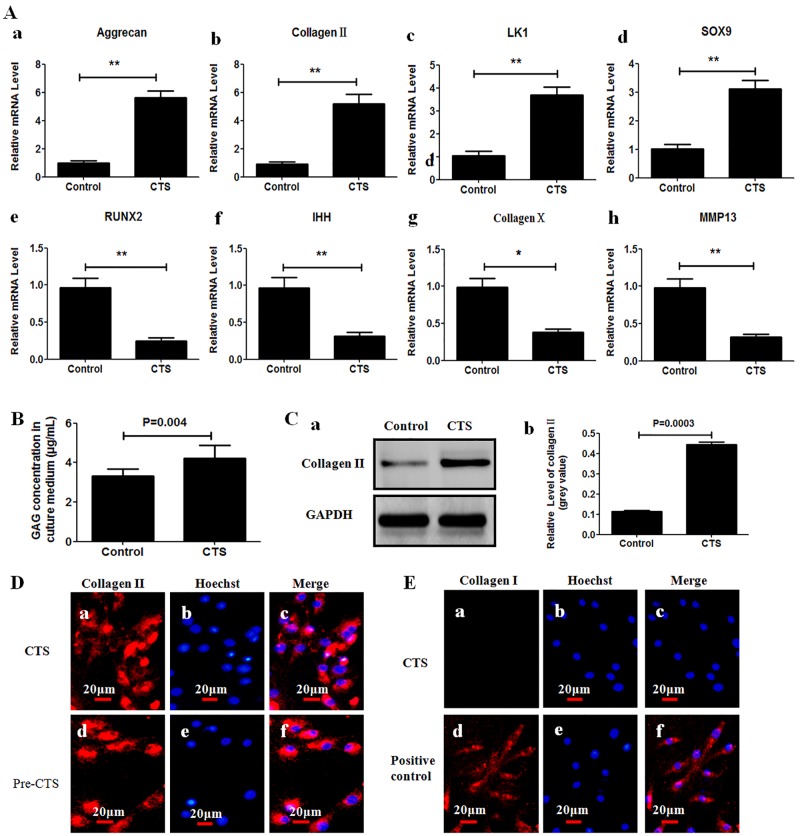
Fig 3. CTS induces anabolism and inhibits differentiation in chondrocytes.
(A) The mRNA levels for aggrecan (a), collagen II (b), LK1 (c), SOX9 (d), Runx2 (e), Ihh (f), collagen X (g) and MMP-13 (h) were compared between chondrocytes subjected to CTS and non-stretched control cells. Values were presented as mean±SD (n = 3). *P<0.05, **P<0.01 versus the non-stretched control group. (B) CTS increased production of glycosaminoglycans. Glycosaminoglycans concentration in culture medium was higher in CTS group than that in control group at 48 h post-CTS. (C) CTS increased protein levels for collagen II. Western blot analysis showed a strong band in CTS group (C-a). Semi-quantitative assay of band densities showed that relative grey value of collagen II protein were higher in the CTS group than that in the control group at 48 h post-CTS(C-b). (D, E) Immunohistochemistry was performed to detect cells phenotype. (D) The cells were both found positive for collagen II at 48 h post-CTS and prior-to-CTS. (E) no chondrocyte was found positive for collagen I at 48 h post-CTS; Skin fibroblasts obtained from newborn mice (C57Bl/6) served as positive control.

