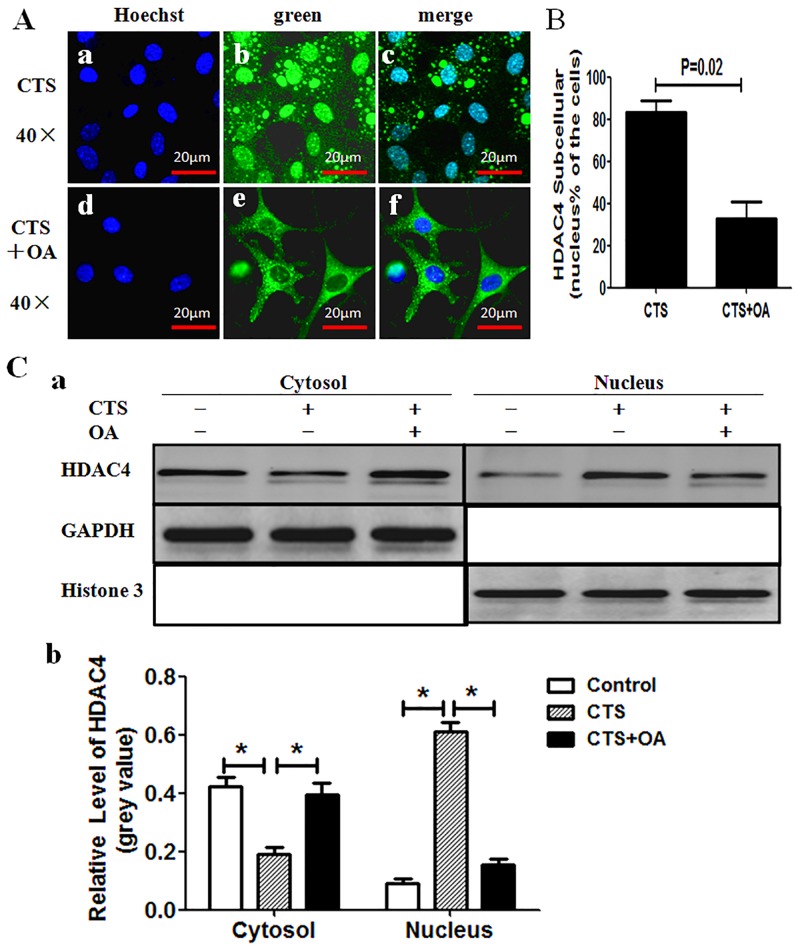
Fig 4. OA impairs the HDAC4 nuclear import induced by CTS.
(A) Fluorescence microscope showed GFP-HDAC4 was mainly located in the nucleus in cells subjected to CTS only (a-c), and mainly in the cytoplasm in cells subjected to CTS with OA (d-f). Green indicated the GFP-HDAC4, and blue indicated cell nucleus stained by Hoechst 33342. (B) Percentage of green GFP-HDAC4 located only in nucleus was scored. 300 cells from 3 independent experiments were counted. Data were expressed as means±SD (P = 0.02). (C) Nuclear and cytoplasmic lysates were separated and followed by western blot analysis with anti-HDAC4 antibody. Histone 3 and GAPDH acted as loading controls for the nuclear and cytoplasmic fraction respectively (C-a). Semi-quantitative assay of band densities showed that cytoplasmic HDAC4 was decreased, and nuclear HDAC4 was increased in CTS group as compared to control group and CTS with OA group; The relative grey value of HDAC4 had no statistics difference between control group and CTS with OA group in both cytoplasm and nucleus (C-b). Values were presented as mean±SD (n = 3), *P<0.05.

