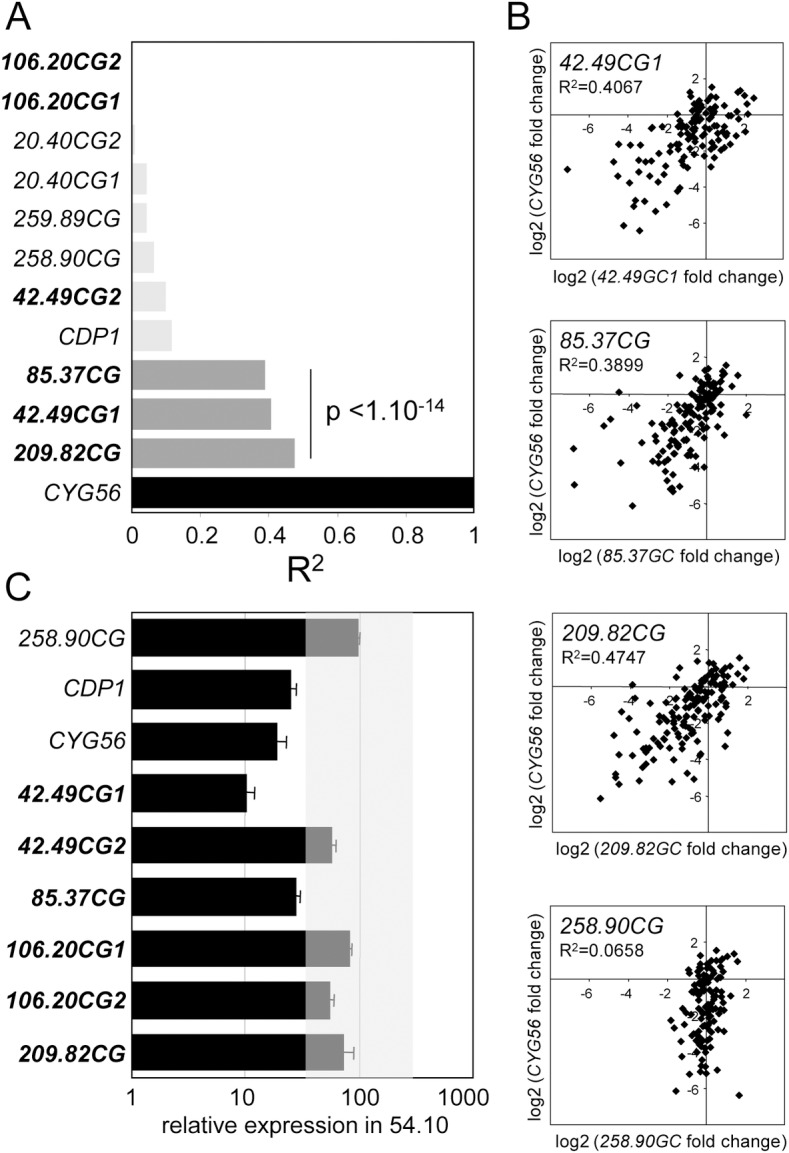
Fig 1. Identification of genes co-regulated with CYG56.

(A) Pairwise correlations between CYG56 expression levels and the expression levels of candidate genes for ammonium signalling. The squared correlation coefficient (R2) and the p values were determined with the Pearson test. 1 indicates a perfect correlation, as illustrated by the correlation of CYG56 expression with itself (black bar). 0 indicates the absence of correlation. The three most significant correlations are indicated in dark grey. (B) Scatter plots showing the data distribution of the three most significant correlations detected in (A). The scatter plot showing CYG56 expression levels plotted against 258.90CG expression illustrates a negative result. (C) Expression of candidate genes in the 54.10 mutant. 54.10 was grown in four nitrogen contexts and harvested at four times points per condition (see Methods), and mean relative expression levels were calculated and presented using the same rationale than in a previous report [28]. Each mean was determined with the 16 data points so that it would reflect the general behaviour of a gene in the mutant and be robust to occasional misregulation patterns of a gene in a particular condition. A threefold cut off (shaded area) is used to highlight the most significant misregulation patterns. CYG56 and CDP1 are shown for comparison, and 258.90CG as an illustration of a negative control. The genes analysed for the first time in this study are shown in bold characters.
