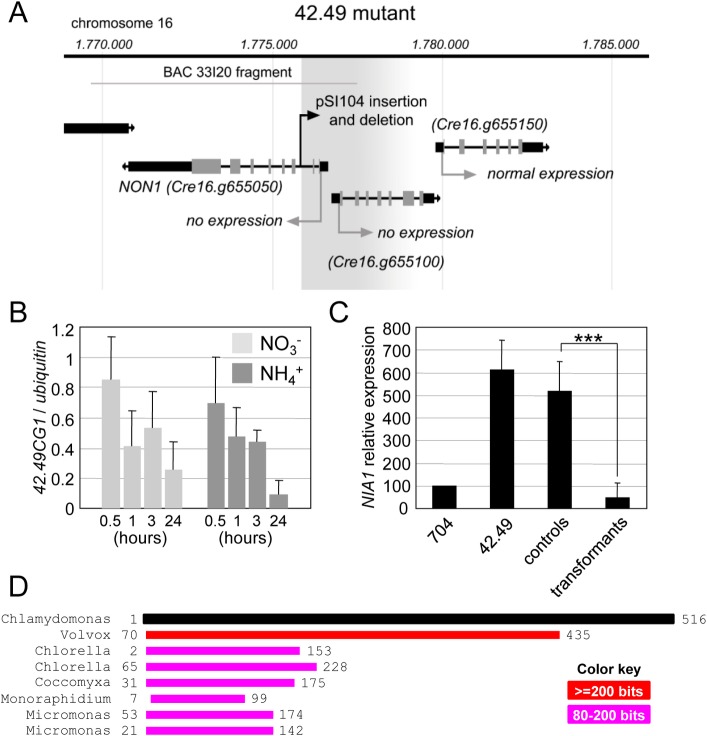
Fig 3. NON1 (candidate gene 42.49CG1) is the gene underlying the AI phenotype of the 42.49 mutant.
(A) Position of the insertion in the 42.49 mutant. The insertion of the pSI104 plasmid took place at position 1775805 on chromosome 16, in the second intron of the NON1 sequence (accession number Cre16.g655050). The two next downstream genes on the chromosome are also represented (accession numbers Cre16.g665100 and Cre16.g655150). Cre16.g665100 corresponds to the second designated candidate gene in this region (42.49CG2). Grey and black boxes indicate exons and UTRs, respectively. The grey arrows mark the start and orientation of the coding sequences. The black arrow indicates the position and orientation of the insert. The grey shaded area starting at the pSI104 position represents the deletion caused by the insertion, and the fading effect illustrates that the right border of the insertion has not been identified. The position of the 7.8 Kb fragment subcloned from BAC 33I20 and used for complementation is represented by a grey line. (B) 42.49CG1 expression was quantified in the wild type strain 704 grown in standard media containing 4 mM of NO3- (light grey) or 8 mM of NH4+ (dark grey). Samples were harvested 30 minutes, 1 hour, 3 hours and 24 hours after induction in the two conditions. The means were calculated based on data from three technical replicates of two biological samples. Error bars represent the standard deviation. (C) Complementation of the AI phenotype with the NON1 gene. The 42.49 mutant was transformed with a plasmid containing the NON1 genomic DNA sequence, and NON1 and NIA1 transcripts were quantified by qRT PCR in the selected lines after 6 hours in medium containing NO3−4 mM and NH4+ 1 mM. Various lines were resistant to the antibiotic but did not express NON1 (S2C Fig), and were used as negative controls. The histogram shows mean NIA1 expression levels in positive transformants (n = 7) and negative controls (n = 5). Error bars represent the standard deviation. *** indicates p ≤ 10−15 with a Student t test (α = 0.05). (D) Graphical output of a BLAST analysis highlighting the conservation of the N terminal part of the NON1 protein with proteins of other algae. Sequence ID numbers of proteins from the different organisms are (from top to bottom): XP_002950714.1 (Volvox carteri), XP_005847655.1 (Chlorella variabilis), XP_005849673.1 (Chlorella variabilis), XP_005645512.1 (Coccomyxa subellipsoidea), KIY97900.1 (Monoraphidium neglectum), XP_002501227.1 (Micromonas sp. RCC299), XP_003062310.1 (Micromonas pusilla CCMP1545). Numbers indicate amino acid positions within the respective proteins.

