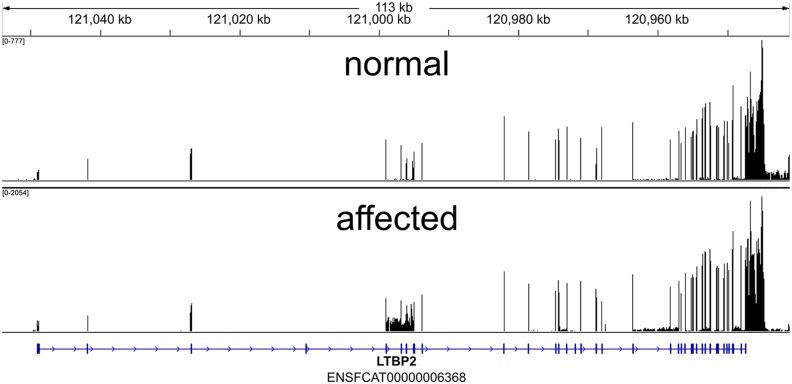
Fig 12. Coverage across Feline LTBP2 exons by RNA-Seq.
RNA-Seq read coverage across the LTBP2 exons within the cat genome. Coordinates are shown in genomic orientation. The numeric range in the top left indicates the minimum and maximum number of reads (FPKM-Fragments Per Kilobase of exon per Million) per base for the sample.

