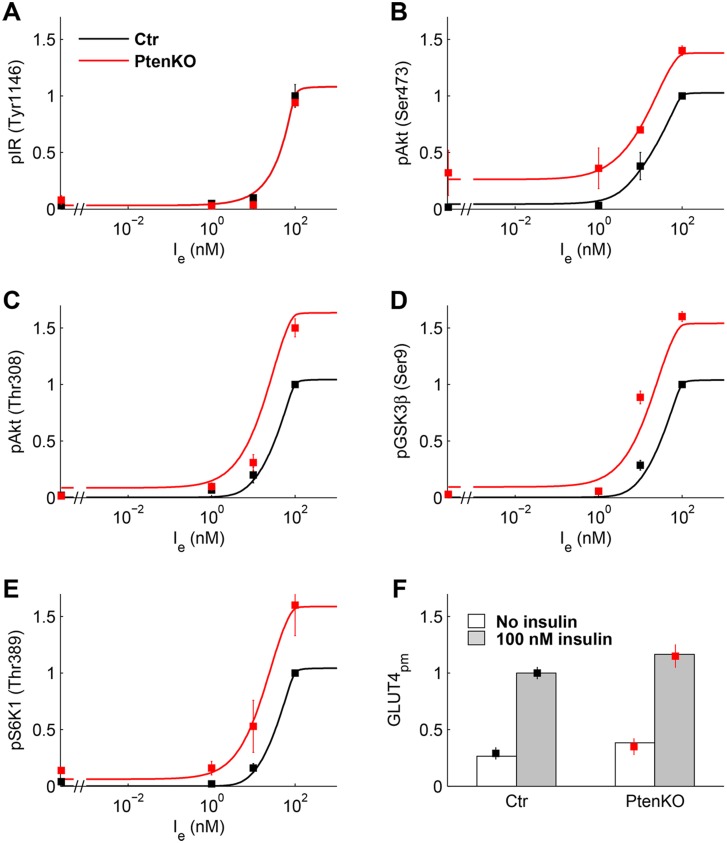
Fig 2. Experimental data of C2C12 myoblast cells and model fitting.
Data (mean ± SEM) replotted from Ref [32] for control (black squares) and PTEN-suppressed (red squares) cells. Solid lines are the dose-response curves predicted by the model for control (black) and PTEN-suppressed cells (red). (A) Relative pIR(Tyr1146). (B, C) Relative pAkt(Ser473) and pAkt(Thr308). (D) Relative pGSK3β(Ser9). (E) Relative pS6K1(Thr389). (F) Relative GLUT4 at PM at zero (white box) and 100 nM (gray box) insulin.

