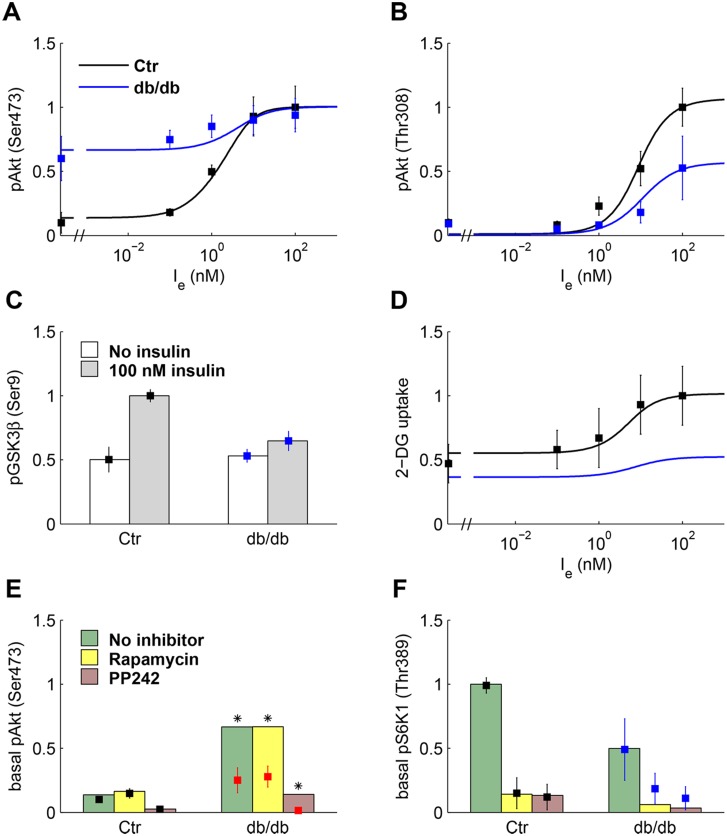
Fig 3. Experimental data of L6 myotubes and model fitting.
Data (mean ± SD) replotted from Ref [11] except panel D from Ref [34]. Data (squares) and model fitting (solid lines) plotted in black for control and in blue for cells exposed to conditioned (db/db) medium. (A, B) Relative pAkt(Ser473) and pAkt(Thr308). (C) Relative pGSK3β(Ser9) at zero (white box) and 100 nM (gray box) insulin. (D) Relative 2-DG uptake in rat L6 myoblasts. (E) Relative pAkt(Ser473) at zero insulin in control (black) and cells exposed to db/db medium (red), in the absence of inhibition and in cells treated with rapamycin (50 nM) and PP242 (500 nM). The red color indicates that experimental values do not preserve the increase in basal pAkt(Ser473) from control to db/db medium in the absence of inhibition, and asterisks point out that these data were not used in model fitting. Green (no inhibitor), yellow (rapamycin), and pink boxes (PP242) represent model fitting. (F) Relative pS6K1(Thr389) at zero insulin in the absence of inhibition and in treated cells (the boxes represent model fitting).

