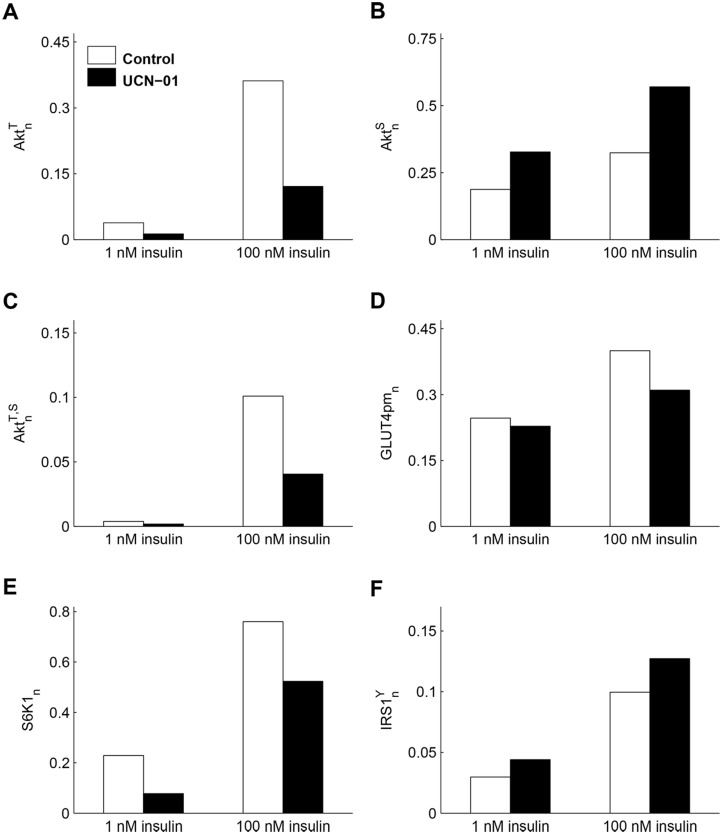
Fig 6. Response of the insulin signaling network to the Akt inhibitor UCN-01 in L6 cells.
(A- C) Model predictions of , and at 1 and 100 nM insulin in control (white boxes) and in cells exposed to UCN-01 (black boxes), obtained by a tenfold decrease of the PDK1 parameter a9. The plots show the marked decrease of and , with the resulting increase in in treated cells compared to control. (D) The model prediction of GLUT4 concentration at plasma membrane highlights the insulin resistance elicited by the drug. (E) S6K1n reduction due to drug action on PDK1. (F) enhancement caused by the weakening of negative feedback.

