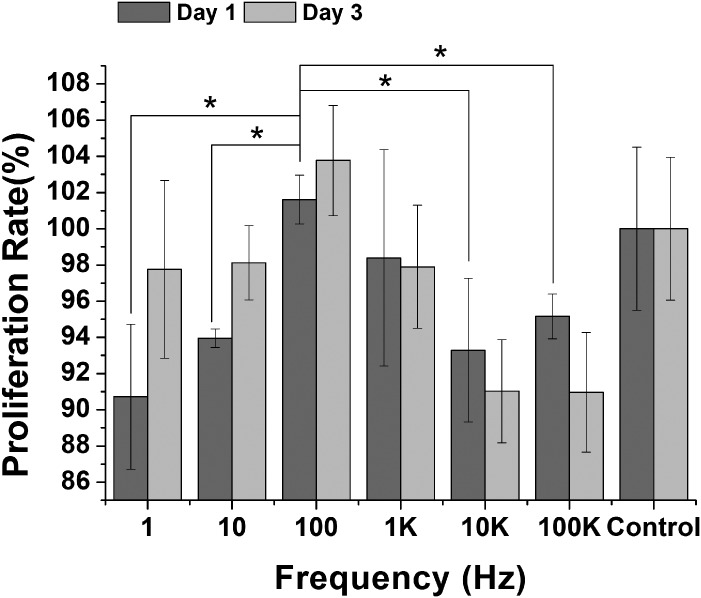
Fig 2. Assessment of Proliferation in MC-3T3-E1 cells after ES.
MTT assay to assess proliferation of the MC-3T3-E1 cells after ES. 100 Hz group has the highest proliferation rate at days 1, 3 compared to the other frequency and control group. 1K Hz group showed similar proliferation compared to control group at days 1, 3. 1 Hz, 10 Hz, 10 KHz, and 100 KHz showed lower proliferation than control group at day 1. (P < 0.05, indicated statistically significant difference)

