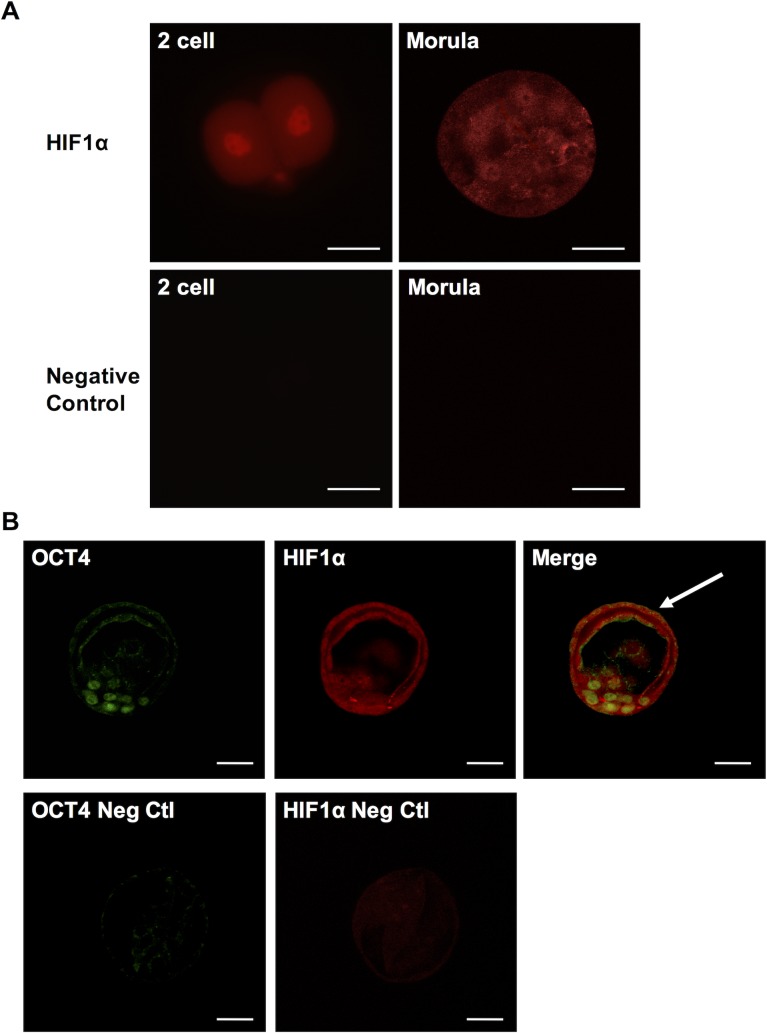
Fig 1. Hif1α expression in preimplantation embryos.
(A) Hif1α staining in two-cell stage embryo and morula (top) and negative control images without primary antibody (bottom). (B) Co-staining of OCT4 and Hif1α in inner cell mass of blastocyst (top) and negative control images without primary antibodies (bottom). Scale bar: 30μm.

