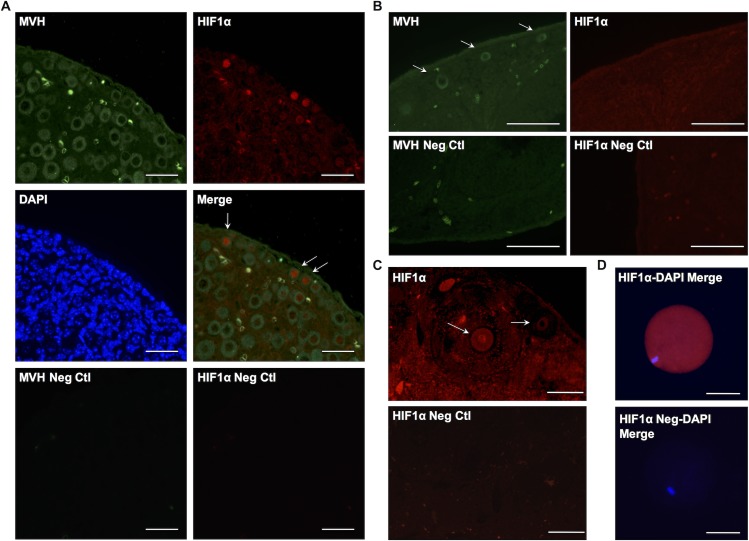
Fig 5. Hif1α expression in neonatal and adult ovary.
(A) Section of P5 ovary showing MVH expression in all oocytes and Hif1α expression only in small oocytes (primary follicles; top). Negative control images without primary antibodies (bottom). Scale bar: 50μm. (B) Section of adult ovary showing absence of Hif1α expression in primary follicles detected with MVH staining (top). Negative control without primary antibody (bottom). Scale bar: 50μm. (C) Section of adult ovary showing Hif1α expression in mature primary oocyte (arrow). Negative control without primary antibody (bottom). Scale bar: 100μm. (D) Image of a Metaphase II oocyte from superovulated three-month-old female showing Hif1α expression. Scale bar: 50μm.

