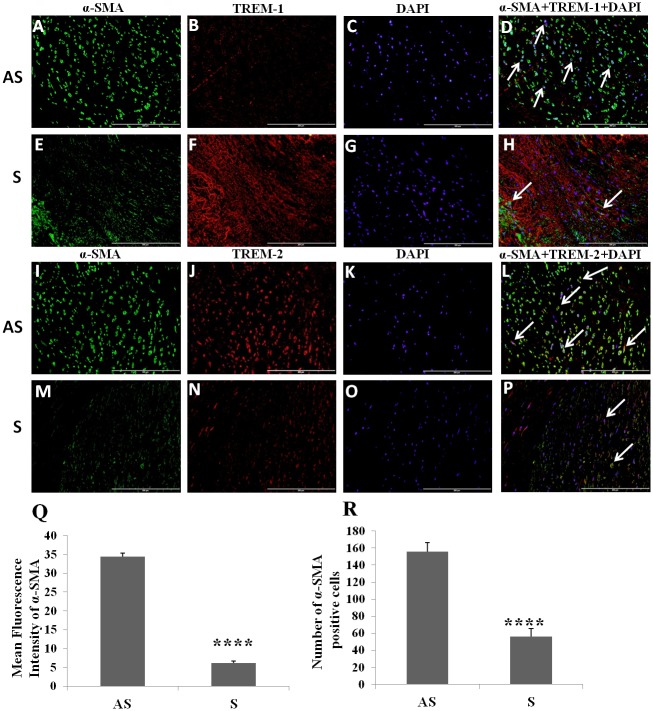
Fig 3. Immunofluorescence staining for α-SMA+ cells and co-localization of α-SMA+ cells with TREM-1 and TREM-2 in carotid plaques.
Immunofluorescence staining for TREM-1 (panels B, F), TREM-2 (panels J, N), α-SMA (panels A, E, I, M), DAPI (panels C, G, K, O) was performed and merged for examining the co-localization of TREM-1 and α-SMA (panels D, H) and for TREM-2 and α-SMA (panels L, P). Arrows show the co-localization of TREM-1 and TREM-2 with α-SMA. These are the representative images of 3 randomly selected samples in each experimental group. Mean fluorescence intensity for α-SMA (panel Q) and number of positive cells for fascin (panel R). Data are shown as mean ± SD (N = 3); *p<0.05, **p<0.01, ***p<0.001 and ****p<0.0001.

