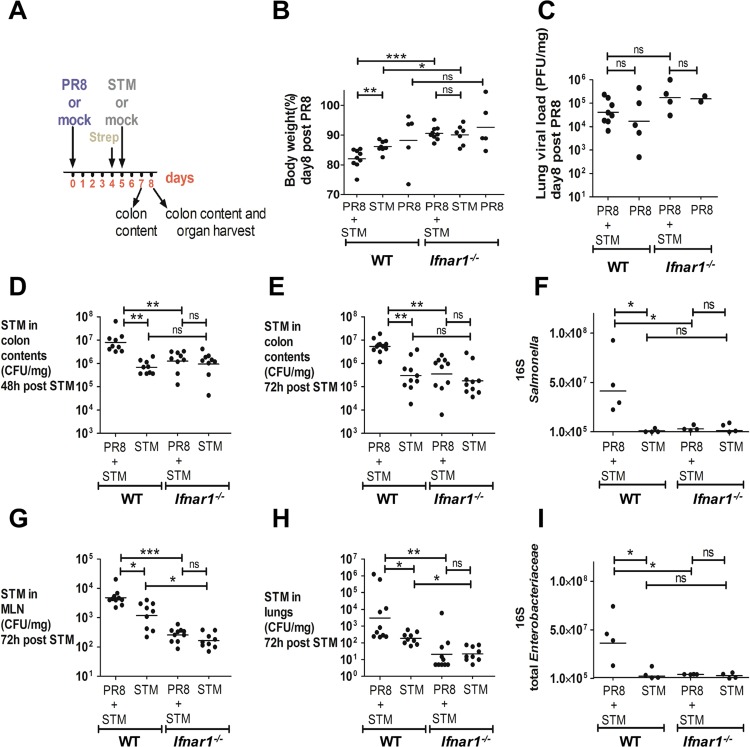
Fig 2. PR8-induced IFN-Is sensitize the host to S. Typhimurium infection.
A) Schematic representation of the PR8-secondary S. Typhimurium infection model. B) Body weight loss at 8 dpi of WT and Ifnar1 -/- mice in secondarily infected, S. Typhimurium-only and PR8-only infected mice. C) Lung viral load was measured at 8 dpi by plaque assay in secondarily infected and PR8-only infected WT and Ifnar1 -/- mice. D, E) S. Typhimurium load in the colon content at 48 h (7 dpi) and 72 h (8 dpi) after bacterial infection. F, I) 16S copy numbers of Salmonella (F) and total Enterobacteriaceae (I) per μl of microbial DNA from colon content determined at 8 dpi. G, H) S. Typhimurium load in MLN and lungs at 72 h after bacterial infection. Each dot represents one mouse, the geometric mean is indicated. P values were calculated by two-tailed Mann-Whitney test in (B, D, E, F, G, H, I). Non-parametric Kruskal-Wallis test was used in (C). *p < 0.05, **p < 0.01, ***p < 0.001; ns, not significant. Two independent experiments are shown in (B, D, E, G, H). A representative experiment is shown in (C). A representative experiment is shown in (F, I). N of mice used in each group in (B): PR8 = 5 WT and 5 Ifnar1 -/-, PR8+STM = 9 WT and 9 Ifnar1 -/-, STM = 8 WT and 7 Ifnar1 -/-. N of mice used in each group in (C): PR8 = 5 WT and 2 Ifnar1 -/-, PR8+STM = 8 WT and 4 Ifnar1 -/-. N of mice used in each group in (D, E, G, H): PR8+STM = 9–10 WT and 9–10 Ifnar1 -/-, STM = 9–10 WT and 9–10 Ifnar1 -/-. N of mice used in each group in (F, I): PR8+STM = 4 WT and 4 Ifnar1 -/-, STM = 4 WT and 4 Ifnar1 -/-. Abbreviations are as follows: STM, S. Typhimurium.

