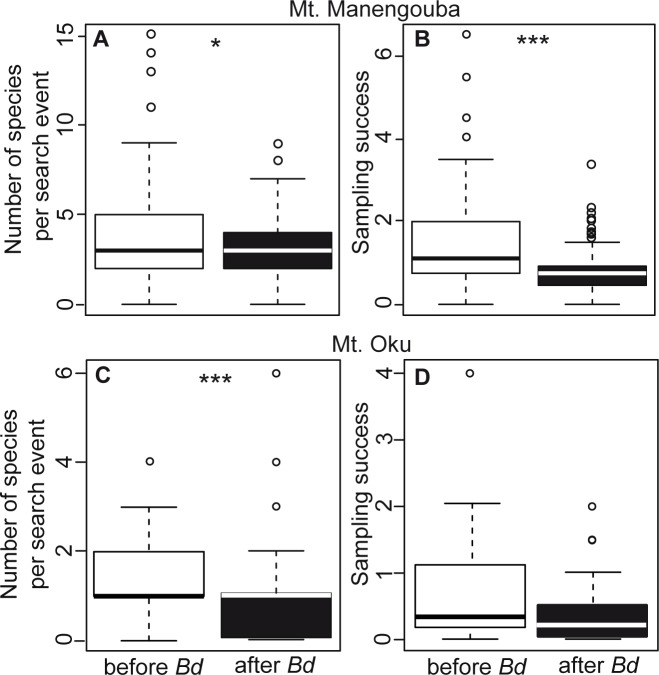
Fig 2. Differences in detected anuran species between search events conducted before and after Bd-positive records in these study regions.
(A) Number of species per sampling event at Mt. Manengouba. (B) Sampling success (number of species recorded per person-hour for each search event at Mt. Manengouba. (C) Number of species per sampling event at Mt. Oku. (D) Sampling success at Mt. Oku. Boxplots depicting events before the detection of Bd in the region are shown as colored white, and those representing events after detection of Bd are shown as colored black. See Table 2 for statistical results and sample sizes

