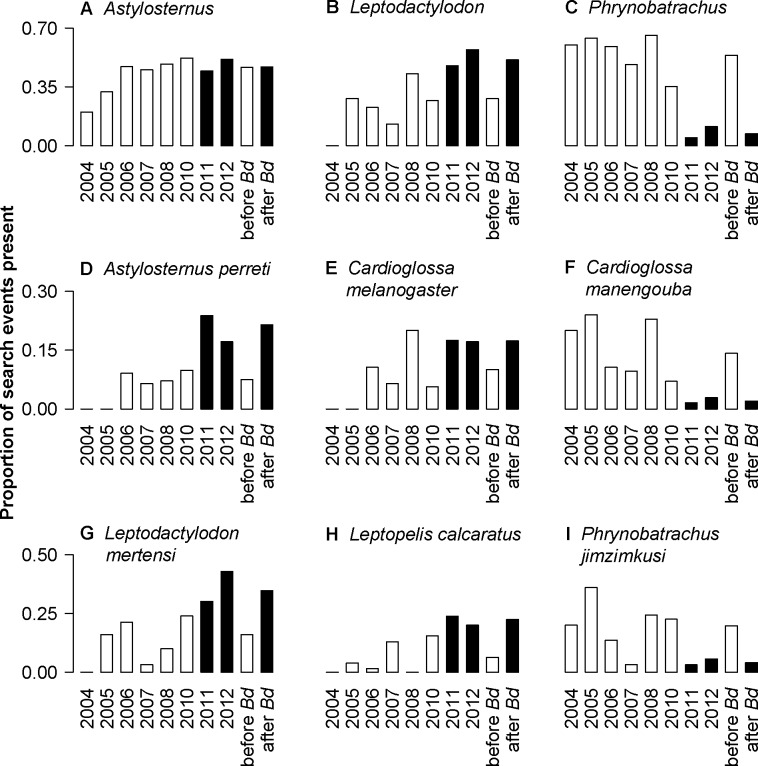
Fig 3. Frequency of detection of selected frog genera and species during all study years on Mt. Manengouba.
Shown is the proportion of search events in which a genus (A-C) or a species (D-G) was present in a given year. The latter two bars show search events in which a genus or species was detected in all search events before and after the first recorded detection of Bd in the region (compare S3 Table). Bars showing events before the detection of Bd are colored white and those showing events after first detection of Bd are colored black. The number of search events was as follows: 2004 = 5; 2005 = 25; 2006 = 66; 2007 = 31; 2008 = 70; 2010 = 71; 2011 = 63; 2–12 = 35. Search events prior to detection of Bd = 366 and after detection of Bd = 98. For additional genus and species information, see S2 Fig.

