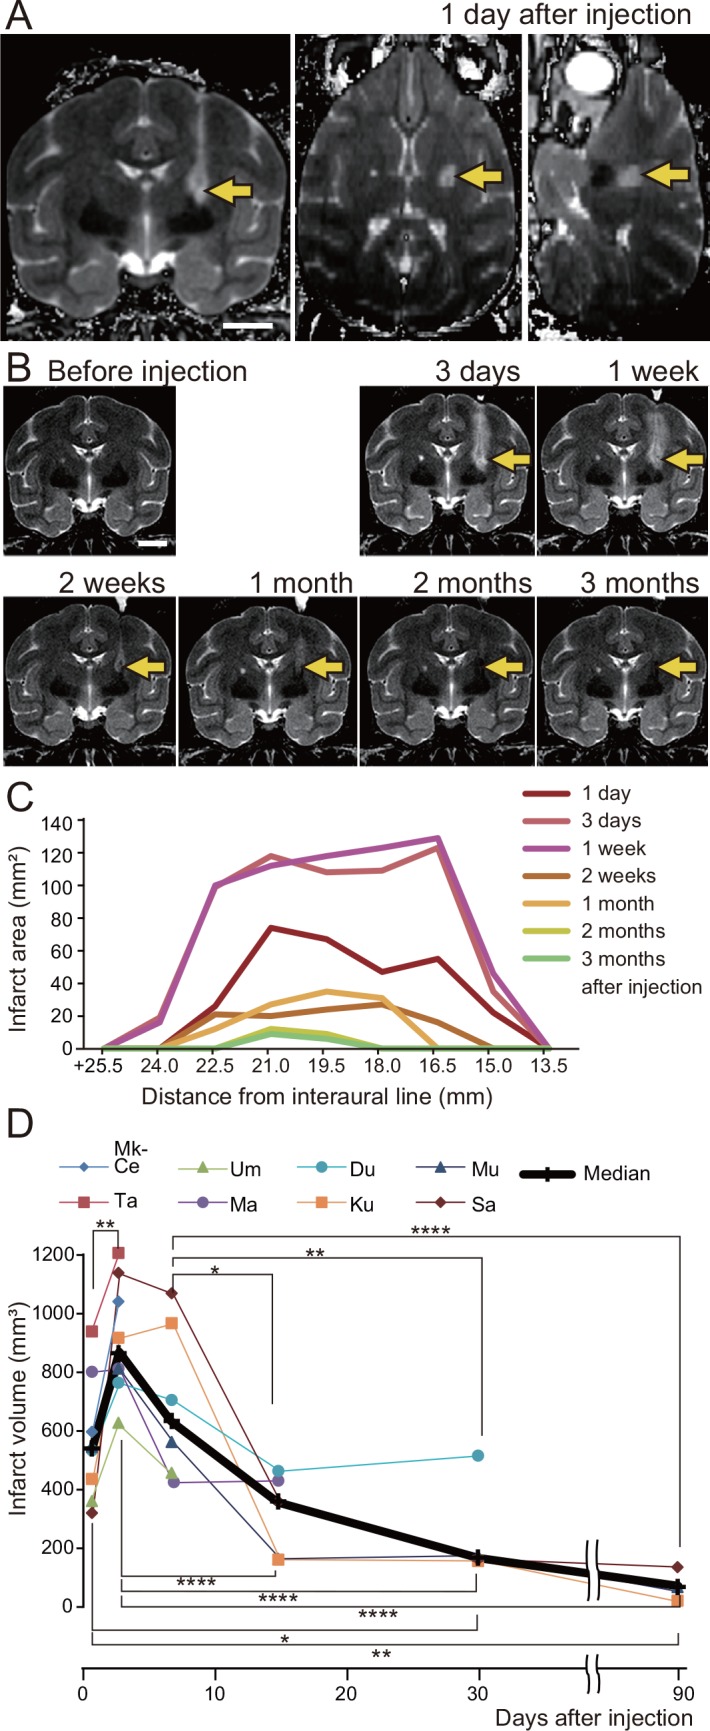
Fig 1. Infarct after endothelin-1 (ET-1) injection.

(A, B) T2-weighted MR images of a macaque’s brain (Mk-Ku), showing the location of the infarct 1 day after ET-1 injection (A, coronal, axial, and sagittal images), and the temporal changes in the infarct during the 3 months after ET-1 injection (B, coronal images). The coronal images are taken 19.5 mm rostral to the interaural line. Arrows indicate the infarct. Scale bars = 10 mm. (C) Temporal changes in infarct expansion in successive coronal images are shown as a function of rostral distance from the interaural line. In this macaque (Mk-Ku), 19.5 and 21 mm rostral to the interaural line correspond to the levels at which motor tracts from the hand area of the primary motor cortex descend. (D) Temporal changes in infarct volume, as calculated for all ET-1 injected macaques (macaque identification numbers are given in the key). Kruskal-Wallis one-way analysis of variance indicated a significant difference of the median infarct volume among the periods after ET-1 injection (P < 0.0001), and Dunn’s post-hoc tests revealed that the infarct volumes at 3 days and 1 week after injection were higher than those in the remaining periods (*P < 0.05, **P < 0.01, ****P < 0.0001).
