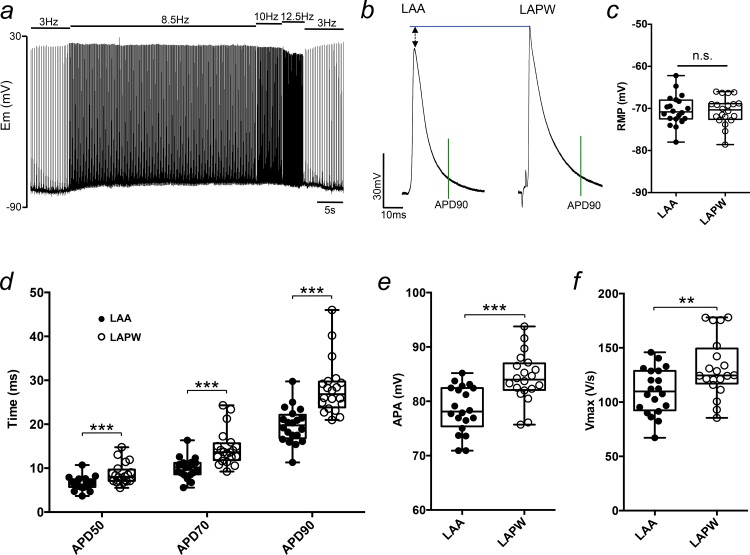
Fig 3. Action potential differences between cardiomyocytes in the left atrial posterior wall (LAPW) and left atrial appendage (LAA).
(a) Example intracellular recording trace demonstrating the stimulation protocol used to achieve sufficient action potential rate adaptation. (b) Example transmembrane action potentials (TAPs) taken from the LAA and LAPW of the same left atrium. TAPs are aligned at the resting membrane potential (RMP). The green vertical line indicates action potential duration at 90% repolarisation (APD90). (c-f) Box and whisker plots and individual values comparing the RMP, APD50-90, action potential amplitude (APA) and dV/dt (Vmax), of the LAA and LAPW, at 10Hz pacing frequency. **, *** denotes P<0.01 and P<0.001, LAA v LAPW, one way repeated measures Analysis of Variance (ANOVA) with Bonferroni post hoc analysis, or paired t-test; N = 20 LA.

