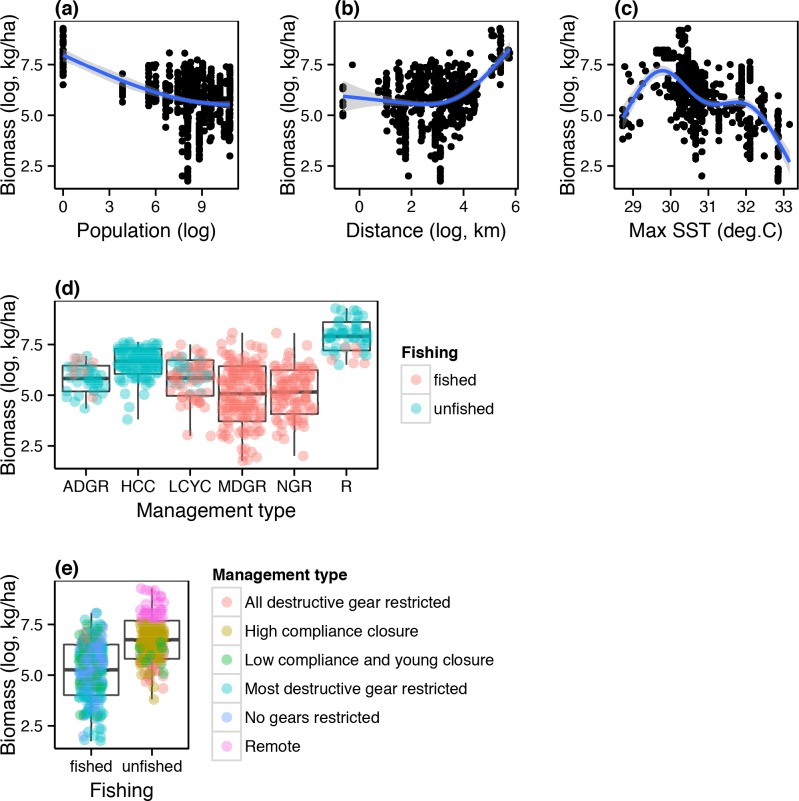
Fig 1. Scatterplots showing the empirical relationships between fish biomass, fisheries management categories, and proxies for the impacts of fishing (i.e. population and distance to markets).
These relationships are based on 214 2.5 x 2.5 km cells where fish biomass data were collected and used to develop a regional biomass model for the total of 11678 2.5 x 2.5 km cells in the region with coral reefs (see Fig 3). ADGR = all destructive gear restricted, HCC = high compliance closure, LCYC = low compliance and young closure, MDGR = most destructive gear restricted, NGR = no gear restricted, R = remote.

