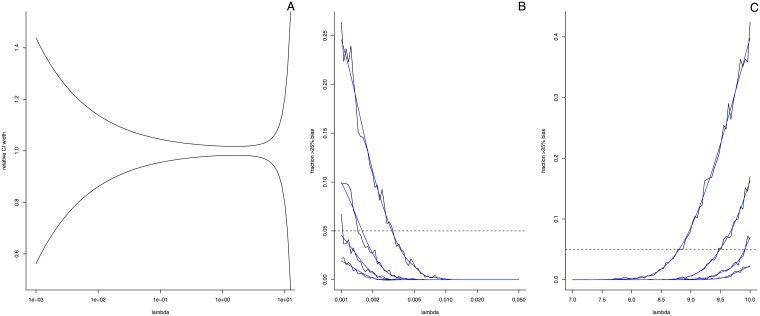
Fig 7. Digital PCR confidence limits.
Panel A shows the relative width of Poisson confidence intervals as a function of the number of target sequences per partition (λ). Panel B and C illustrate how many percent of the λ estimates of a 20 000 partition system contain 25% or more error as calculated via parametric bootstrap for different numbers of repeated analysis (single reaction, duplicate, triplicate, and four repeats). Replicates are averaged to obtain the final estimate. The black lines show the actual percentages obtained, the blue lines show a smoothed version of the curve. The dashed horizontal line represents five percent.

