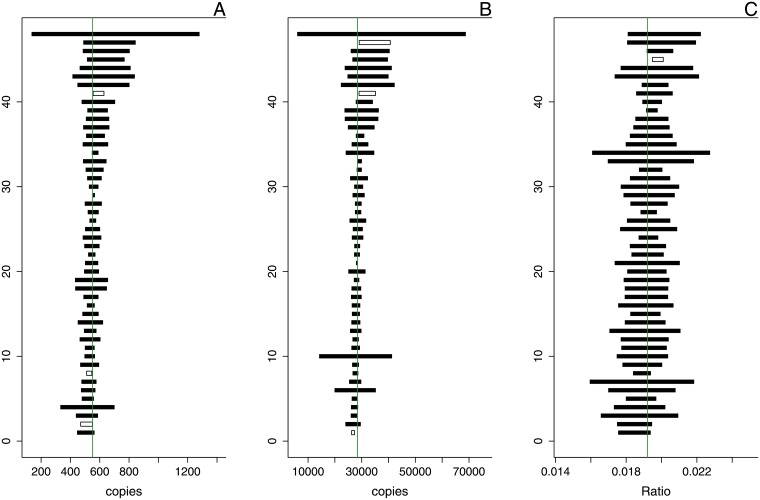
Fig 10. Confidence intervals for 48 independent dilutions based on standard deviation of repeated measurement.
The vertical line indicates the median estimate, confidence intervals that contain this value are coloured black, confidence intervals that do not contain this value are represented as empty boxes. Panel A shows the results for a rare target, Panel B shows the results for an abundant target, and Panel C show the results of their ratio, the respective CI coverage factors for the panels are: 93.75, 93.75, and 97.92 percent.

