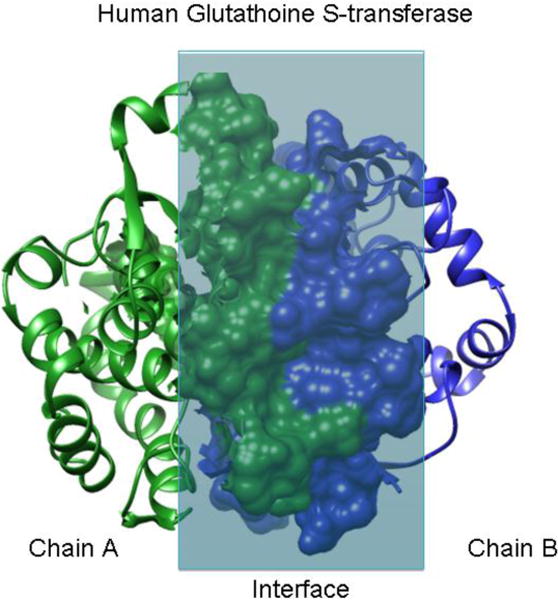
Figure 1. Protein–protein interaction interface.

Human glutathione S-transferase. Chains A and B are shown in green and blue. The residues interacting within the interface are shown in a molecular surface representation, while the remainder of the structure is displayed in a ribbon diagram [12].
