
Figure 1.
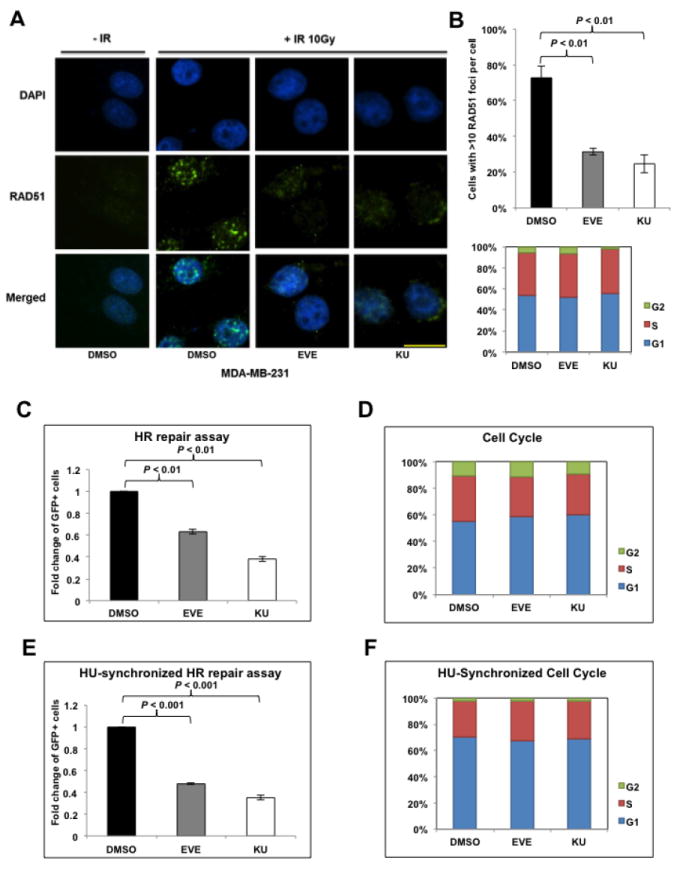
mTOR inhibitors suppress homologous recombination (HR) repair.
A. Microscopic analysis of MDA-MB-231 cells pretreated with dimethyl sulfoxide (DMSO, control) or mTOR inhibitors everolimus (EVE, 10 μM) or KU-0063794 (KU, 10 μM). DAPI was used for visualization of the nucleus. Images are representative of three independent experiments. Scale bar, 10 μm. B. Percentage of MDA-MB-231 cells with more than 10 RAD51 foci per cell in at least 50 cells for each treatment (upper panel). Means±SD (error bars) of three experiments are shown. P < 0.01 (EVE vs DMSO; KU vs DMSO). Lower panel demonstrates the cell-cycle distribution in MDA-MB-231 cells pretreated with EVE or KU. C. U2OS-DR-GFP cells treated with EVE (10 μM) or KU (10 μM) were subjected to HR repair assay. Each value is relative to the percentage of GFP-positive cells in pCBASceI-transfected control cells. Results are shown as means±SD from three independent experiments. P < 0.01 (EVE vs DMSO; KU vs DMSO). D. Cell-cycle analysis results for Figure 1C. E, U2OS-DR-GFP cells were treated with EVE (10 μM) or KU (10 μM) after pCBASceI transfection and were then treated with hydroxyurea (HU, 2 mM) to synchronize the cell cycle for 16 hours before the HR repair analysis. Results are shown as means±SD from three independent experiments. P < 0.01 (EVE vs DMSO; KU vs DMSO). F. Cell-cycle analysis results for Figure 1E.