
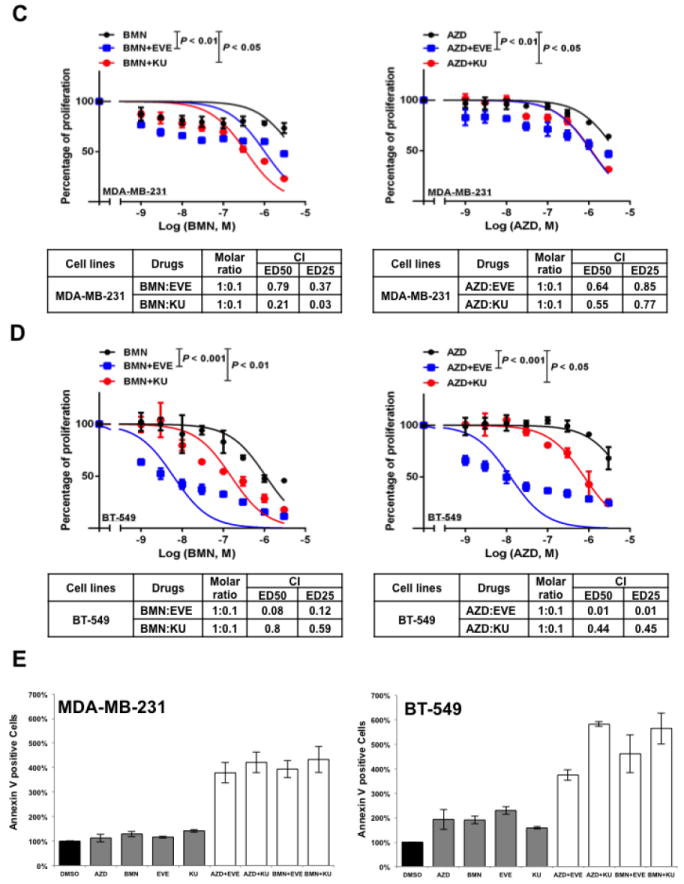
Figure 2.
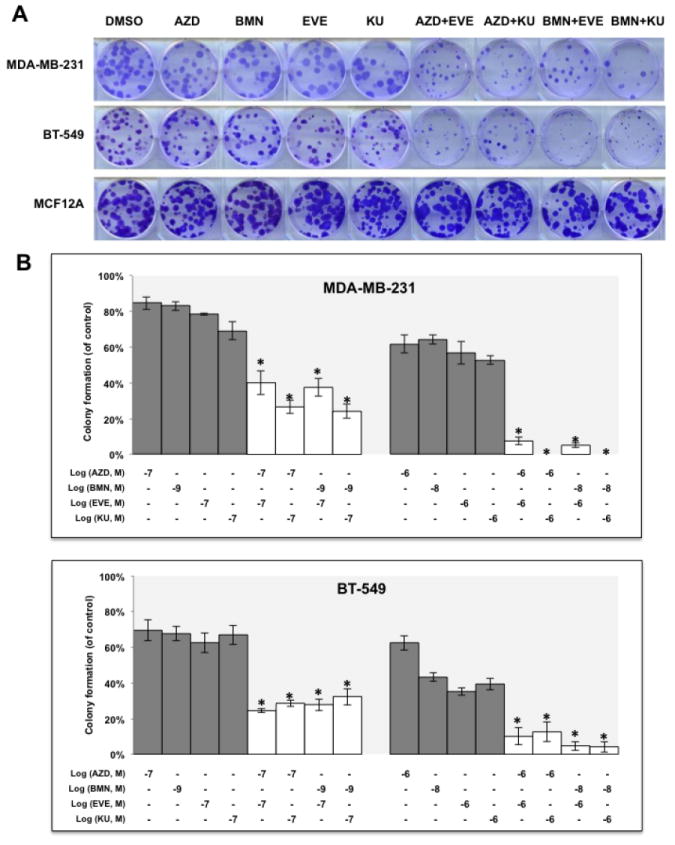
mTOR inhibitors synergize with PARP inhibitors in BRCA-proficient TNBCs in vitro.
A. Colony formation assay results for MDA-MB-231 and BT-549 cells treated with DMSO, mTOR inhibitor alone (EVE, 10-7 M; KU, 10-7 M), PARP inhibitor alone (AZD, 10-7 M; BMN, 10-9 M) or the indicated combinations of agents. Images are representative of at least three independent experiments. B. Representative results of the quantification of the colonies treated with the indicated concentrations of mTOR inhibitors and PARP inhibitors as shown in Fig 2A. Values are relative to those of DMSO-treated cells and represent the mean±SD from three independent experiments. *P < 0.05 (combination vs single-agent treatment). C. Cell proliferation assay of MDA-MB-231 cells treated with single agents or combinations of PARP inhibitor BMN (left panel) or AZD (right panel) with mTOR inhibitors EVE or KU. Each value is relative to the value of cells treated with DMSO (control). Results are shown as mean±SD from three independent experiments. The combination index (CI) values are listed at the bottom. ED25 and ED50 represent 25% and 50% effective dose, respectively. D. Cell proliferation assay of BT-549 cells treated with single agents or combinations of BMN (left panel) or AZD (right panel) with EVE or KU. Each value is relative to the value of cells treated with DMSO (control). Results are shown as means±SD from three independent experiments. The CI values are listed at the bottom. E. Apoptosis analysis of MDA-MB-231 (left panel) and BT-549 cells (right panel) treated with the indicated single agent (AZD, 2 μM; BMN, 2 μM; EVE, 2 μM; KU, 2 μM) or different combinations of PARP inhibitors and mTOR inhibitors. Results are shown as means±SD from three independent experiments.