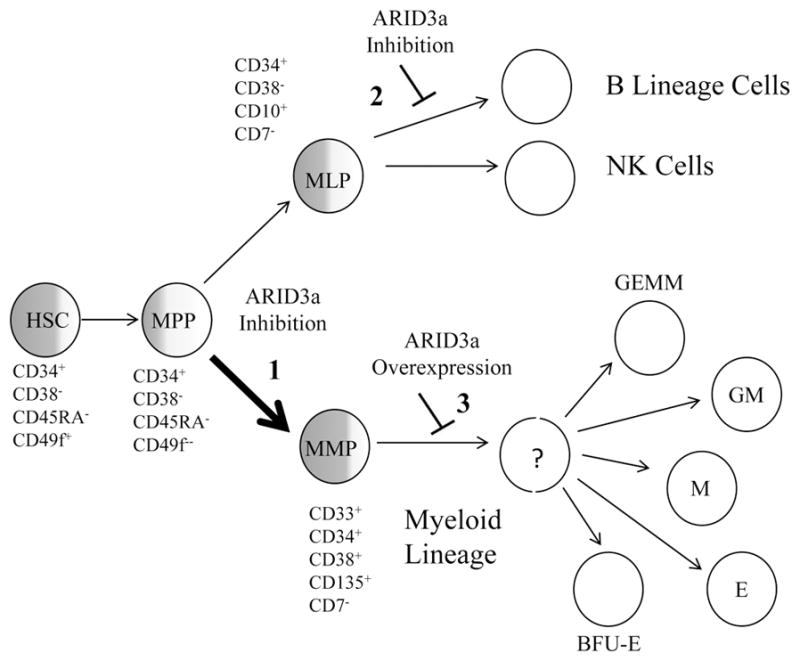
Figure 8.

Schematic diagram for ARID3a functions during human hematopoiesis. Degrees of shading represent the proportion of cells initially expressing ARID3a in HSPC subsets HSC, hematopoietic stem cell; MPP, multipotent progenitor, MLP, multi-lymphoid progenitor and MMP, multi-myeloid progenitor. ARID3a inhibition resulted in increased development of myeloid lineage cells (1, thicker arrow) versus lymphocyte lineages, and inhibited B lymphocyte lineage development without affecting natural killer (NK) cells (2). Conversely, ARID3a over-expression blocked myeloid lineage development at unidentified stages resulting in decreased maturation of erythroid (E), monocyte (M), granulocyte/monocyte (GM), granulocyte/erythroid/megakaryocyte/monocyte (GEMM) and erythroid burst blast (BFU-E) colonies (3).
