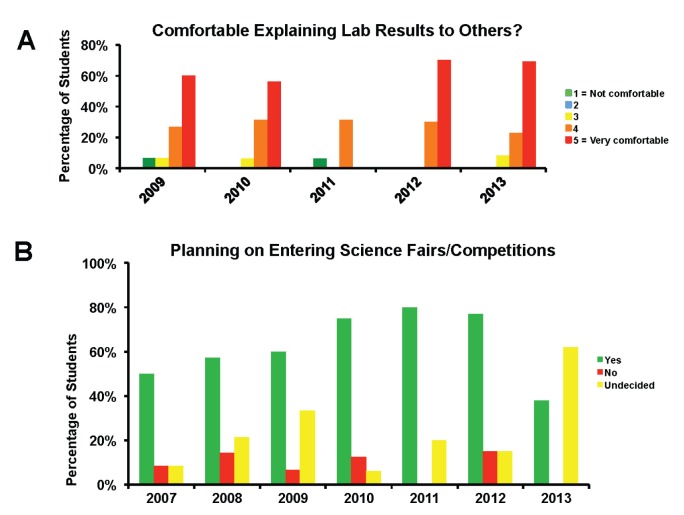
FIGURE 5.
Assessment of scientific communication in the SCC. SFP Scholars’ answers to survey questions about their SCC experience. Percentage of Scholars selecting each answer (bars) on the y-axis. Questions were ranked on a five-point scale, 1 being the most negative and 5 the most positive. A. Student responses to the question, “How comfortable do you feel explaining your laboratory results to others?”, evaluated in the end-of-summer survey (2009–2013). B. Percentage of students who plan to enter science fairs or competitions per year, evaluated in the end-of-summer survey (2007–2013). SCC = science communication course; SFP = summer focus program.

