Figure 3.

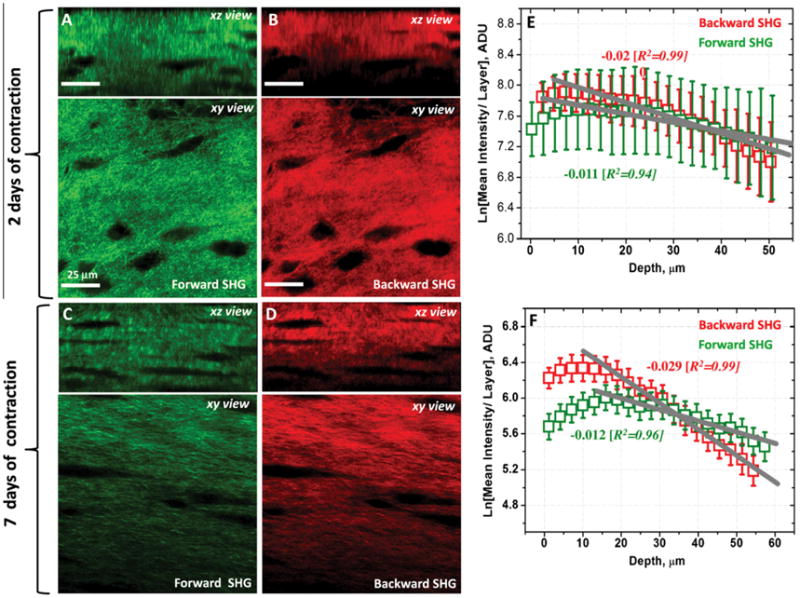
(A, B, C and D) Representative forward detected SHG and backward SHG images originating from the contracted collagen matrix in the stimulated cellular environment after 2 and 7 days of contraction. Both xy- and xz- are shown to provide sufficient spatial distribution details of the collagen matrix in the 3D space. [See also Supplementary file: 3D Slice Overlay-7 days of contraction.wmv]. (E and F) The natural logarithm of mean intensity per layer (i.e. total voxel intensity/total layer area) of forward and backward SHG images as a function of collagen raft depth after 2 and 7 days of contraction. Both forward and backward scattered SHG signal intensities decay as a function of the depth. The decay is relatively strong in the case of backward directed SHG signals particularly after 7 days of contraction.
