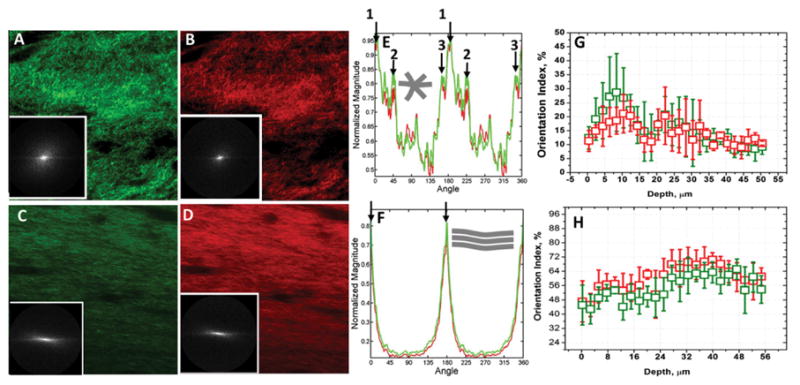
Figure 5.

(A, B, C and D) Representative forward and backward SHG images originating from the contracted collagen matrix after 2 and 7 days of contraction are shown. Fig. inserts show their respective power density spectrum (PSD). (E) PSD plot of collagen matrix after two days of contraction shows the high frequency components of both forward and backward SHG signals are condensed at multiple angles and directions, indicating criss-cross arrangements collagen fibers. (F) PSD plot after 7 days of contraction shows that the collagen fibers are preferentially oriented in one direction rather than criss-cross arrangement. (G) Computed orientation index of collagen raft after 2 days of contraction as a function of depth. Since the fibers are preferentially oriented in criss-cross pattern in this case, the mean orientation index values of collagen fibers for both forward and backward SHG signals are found to be low. Inserted schematic shows collagen fibers oriented in multiple directions. (H) Computed orientation index of collagen raft after 7 days of contraction as a function of depth. Computed layer-by-layer orientation index values are significantly higher. Inserted schematic shows collagen fibers preferentially oriented in one direction.
