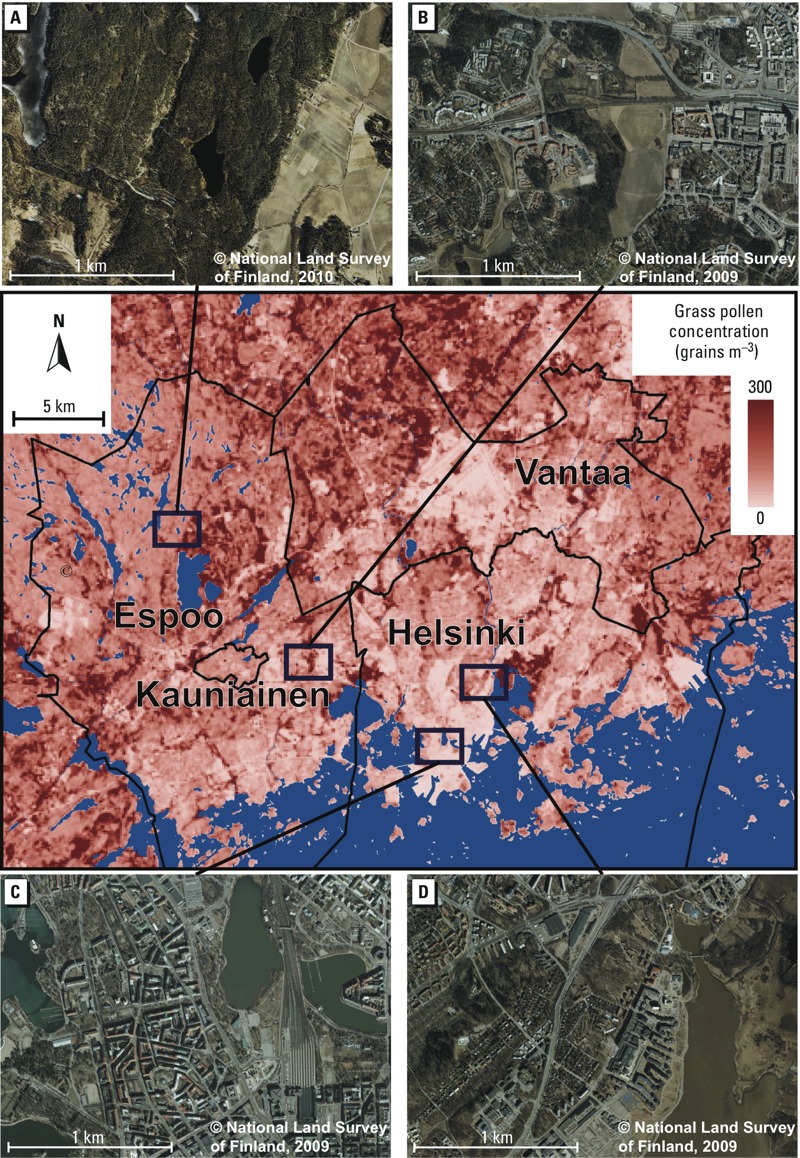
Figure 4.

A smoothed prediction map of the grass pollen concentration (grains/m3; afternoon situation during 27 June–9 July 2013) at a 100-m resolution and aerial photographs (A–D) (resolution = 50 cm) representing different environmental conditions within the Helsinki metropolitan area, Finland. The predictions were computed using the final generalized linear model and n = 14 data set. To consider the potential statistical problems related to outlier observations in the n = 16 data set (see the “Methods” and “Results” sections) the smaller data set was used in the prediction (i.e., in the extrapolation of the model beyond the environmental conditions of the calibration area) [National Land Survey of Finland (http://www.maanmittauslaitos.fi/en/kartat)].
